Built-in statistics in quizzes
Every quiz on Flexbe has a set of statistics data that show the conversion rate, number of views for each question, bounce rate and answer statistics.
To view statistics, go to the quiz editor.
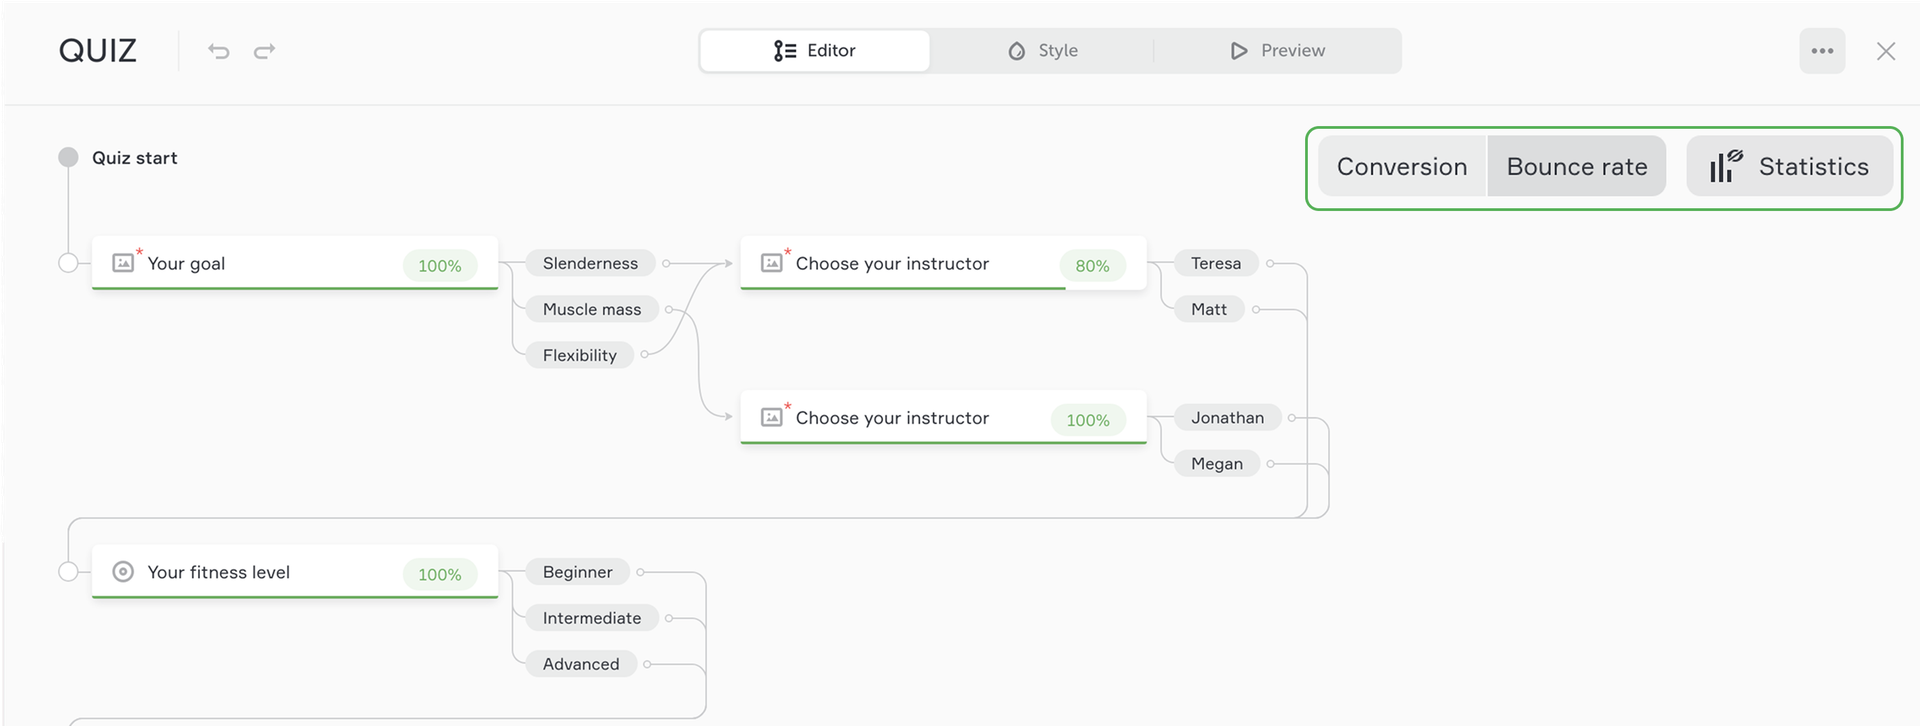
The quiz editor allows creating questions and adding branching. The Statistics tab is also found here, in the top right corner.

There are two tabs in the Statistics menu: Conversion and Bounce rate. You can switch between the tabs. They represent two parts of the same data but the Conversion tab focuses on the percentage of visitors who give answers and continue the quiz, and the Bounce rate tab shows the percentage of those who refuse to answer a question and close the quiz.

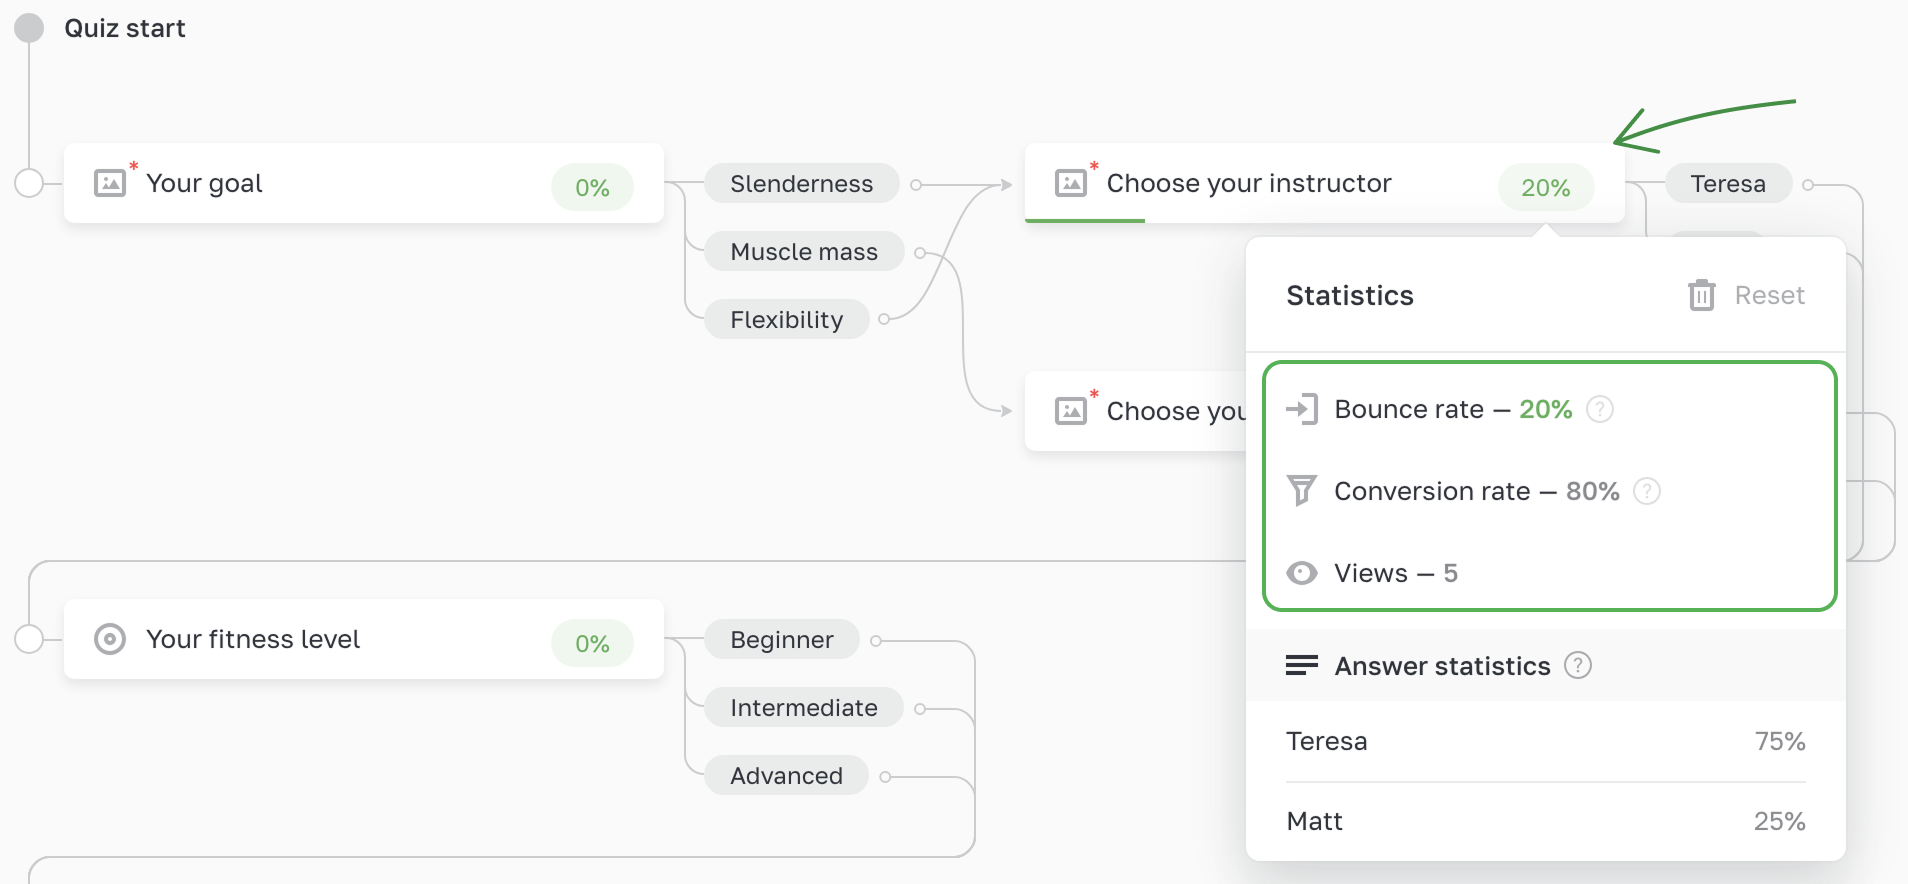
Each question has a more detailed set of data. Click the percentage bubble to open the menu and view its Conversion and Bounce rates, Views and Answer statistics.

Using this data, you can figure out which questions cause the highest bounce rate and modify them. People often refuse to answer questions that require them to give too detailed or specific answers.
TIPIf you see that people are reluctant to give their contact information, perhaps, instead of asking directly for an email address, you could try offering a bonus, such as "Get a Comprehensive Guide for Free".
Learn more about quizzes and how to make custom results for them.